
Case:
How SOFTICO automated recruiting and management reporting using Tableau HR dashboard
 4 min.
 01.10.2025

HR-департамент

Webinar plan
Introduction: Tableau—Analytics That Drive Business Forward
Чому сучасна аналітика — не просто графіки,
а бізнес-механізм прийняття рішень.
Why some BI projects take off,
and others don't
Insights from the experience of SOFTICO customers.
Examples where BI has already changed the game.
BI is not a magic button
Popular myths and explanations of how BI really works.
BI does not "fix" bad data, does not eliminate duplicates,
does not create meaning where there is none.
Tableau is not just reporting, but an insights platform,
integration and automation.
Data architecture:
the foundation of effective BI
The logic of building BI as an ecosystem.
Structure: Sources → ETL → Warehouse →
Showcases → BI. What does the "single version of the truth"
mean and why is it critical for management decisions.
Tableau Blueprint allows you to scale analytics
without overloading systems.
Data roles and culture:
main BI engine
BI is a team of robots:
- Center of Expertise (CoE) - coordinates the approach, standards and training.
- Business users - create queries, test and use dashboards.
- IT partners - responsible for security, integrations, and updates.
The Role of the BI Owner: Connecting Business and Technology, turn reports into actionable tools.
How BI becomes a system that works
Stages according to Tableau Blueprint:
- Ignite is a quick win: one case study that demonstrates the value of BI.
- Empower is a standard setting, training, and expertise center.
- Outperform - automation, AI analytics, forecasting.
- Tableau + AI: automatic insights, alerts, smart suggestions.
Q&A
Summarize the results and answer questions from the audience at
.
Realization
We analyzed the processes, identified points of delay and inefficiency. We assessed what data is collected manually and what systems are used (CRM, Excel). Based on this, we formed the requirements for the future dashboard.
We prepared the basis. We integrated CRM with Tableau and set up real-time data transfer. We developed the structure of the HR dashboard, identified key performance indicators (KPIs), and created a design for easy data visualization.
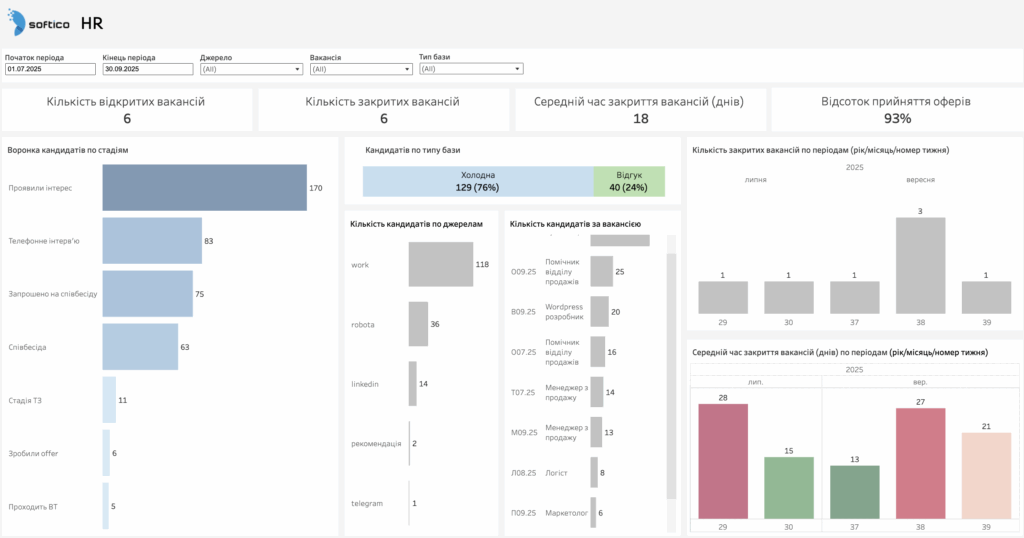
We built an interactive online Tableau dashboard with automatic updates of metrics: vacancy closure rate, channel efficiency, and feedback dynamics. The HR department received full management reporting in a few clicks.
After implementation, analysts tracked the results and adapted the dashboard to the needs of the team. We added separate BI panels for management and analytical sections by department.
Tableau Prep for integration with an existing CRM, Tableau Desktop for visualization, and automated reporting.
During the integration, we discovered differences in data formats between CRM and Excel spreadsheets. Some of the processes had to be rebuilt, but thanks to the SOFTICO team of analysts, we achieved stable system operation and transparent analytics.
Implementation results
HR-звітів
завдяки дашборду
актуальних
даних
ухвалення
рішень

Customer feedback
The introduction of the HR dashboard was a real breakthrough for us. We received a tool that removed the routine and allowed us to see the real picture of the processes at any time.We especially appreciate the team’s responsiveness, deep understanding of business processes, and ability to translate analytics from technical language into understandable solutions for HR.

Conclusion.
Creating Tableau dashboards is not just a data visualization, but a real tool for accelerating business processes and making management decisions.
Do you want to implement Tableau in your company and automate the reporting of the HR department or other departments?
Contact us – we will conduct a Tableau demo, show you how analytics will work in your business case, and create a free pilot dashboard to help you see the platform’s capabilities.