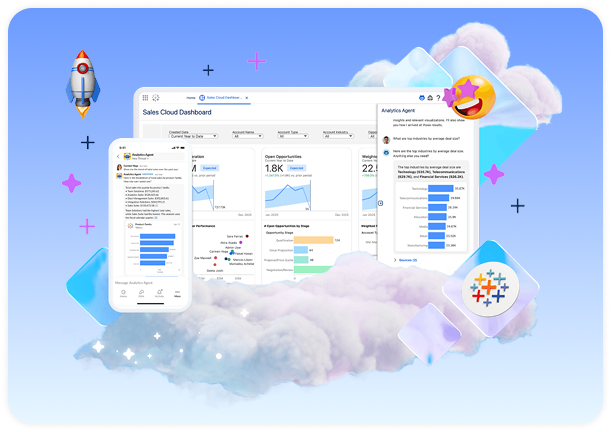
Introduction: Tableau - analytics,
that drives business forward
Why modern analytics is not just about graphs,
but a business decision-making mechanism.
Як зробити вашу BI системою, що
працює: від звітів до інсайтів
Бізнес-аналітика давно вийшла за межі звичайних звітів — сьогодні це стратегічний інструмент, який визначає швидкість і якість рішень. Але чому в одних компаній BI стає драйвером зростання, а в інших — черговим “незрозумілим дашбордом”?
Під час вебінару наш спікер поділиться реальними прикладами того, як перетворити BI з набору графіків на систему, що дійсно працює. Ви дізнаєтеся, які кроки допомагають зробити аналітику джерелом інсайтів, а не зайвою витратою часу та ресурсів.
Why modern analytics is not just about graphs,
but a business decision-making mechanism.
Insights from the experience of SOFTICO customers.
Examples where BI has already changed the game.
Popular myths and explanations of how BI really works.
BI does not "fix" bad data, does not eliminate duplicates,
does not create meaning where there is none.
Tableau is not just reporting, but an insights platform,
integration and automation.
The logic of building BI as an ecosystem.
Structure: Sources → ETL → Warehouse →
Showcases → BI. What does the "single version of the truth"
mean and why is it critical for management decisions.
Tableau Blueprint allows you to scale analytics
without overloading systems.
BI is a team effort:
The role of a BI owner is to combine business and technology.
Stages of Tableau Blueprint:
Summarizing the results and answering questions from the audience.
how to understand
why your BI doesn't give
the expected effect
what
components form a working
analytics system
how to build
the right
data architecture and ETL processes
how to create a culture of
data and define
roles in the BI team
how to apply Tableau
Blueprint for the development of
BI in your company
© 2026 Tableau Ukraine